Forests play a central role in carbon sequestration, and tracking biomass dynamics is essential for climate change mitigation, reforestation planning, and sustainable forest management. Aboveground biomass is a key proxy for stored carbon in vegetation; understanding its spatial distribution helps track carbon stock changes over time. Forests act as carbon sinks, playing a critical role in climate change mitigation—biomass mapping supports efforts like REDD+ by informing carbon accounting and emissions reduction strategies. Accurate biomass maps also guide sustainable forest management, conservation planning, and reforestation by highlighting high-carbon and vulnerable areas. We evaluate the use of allometric equations and vegetation indices (e.g., NDVI, CIgreen, NIRv) in biomass estimation, highlighting the complementary roles of LiDAR for 3D structure and spectral data for vegetation condition. This integrated remote sensing approach enables detailed, scalable biomass monitoring across different forest types and stages.
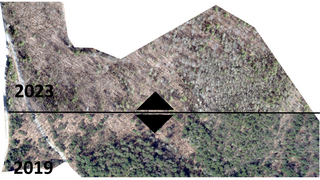
This project examines aboveground biomass (AGB) changes in two ecologically distinct forest ecosystems in Connecticut: Cathedral Pines (an old-growth forest) and Naugatuck State Forest (a secondary-growth site). Using high-resolution LiDAR and 4-band aerial imagery acquired in 2023, we assessed changes in forest structure and carbon stocks between 2016 and 2023.
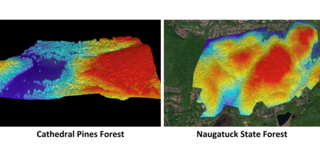
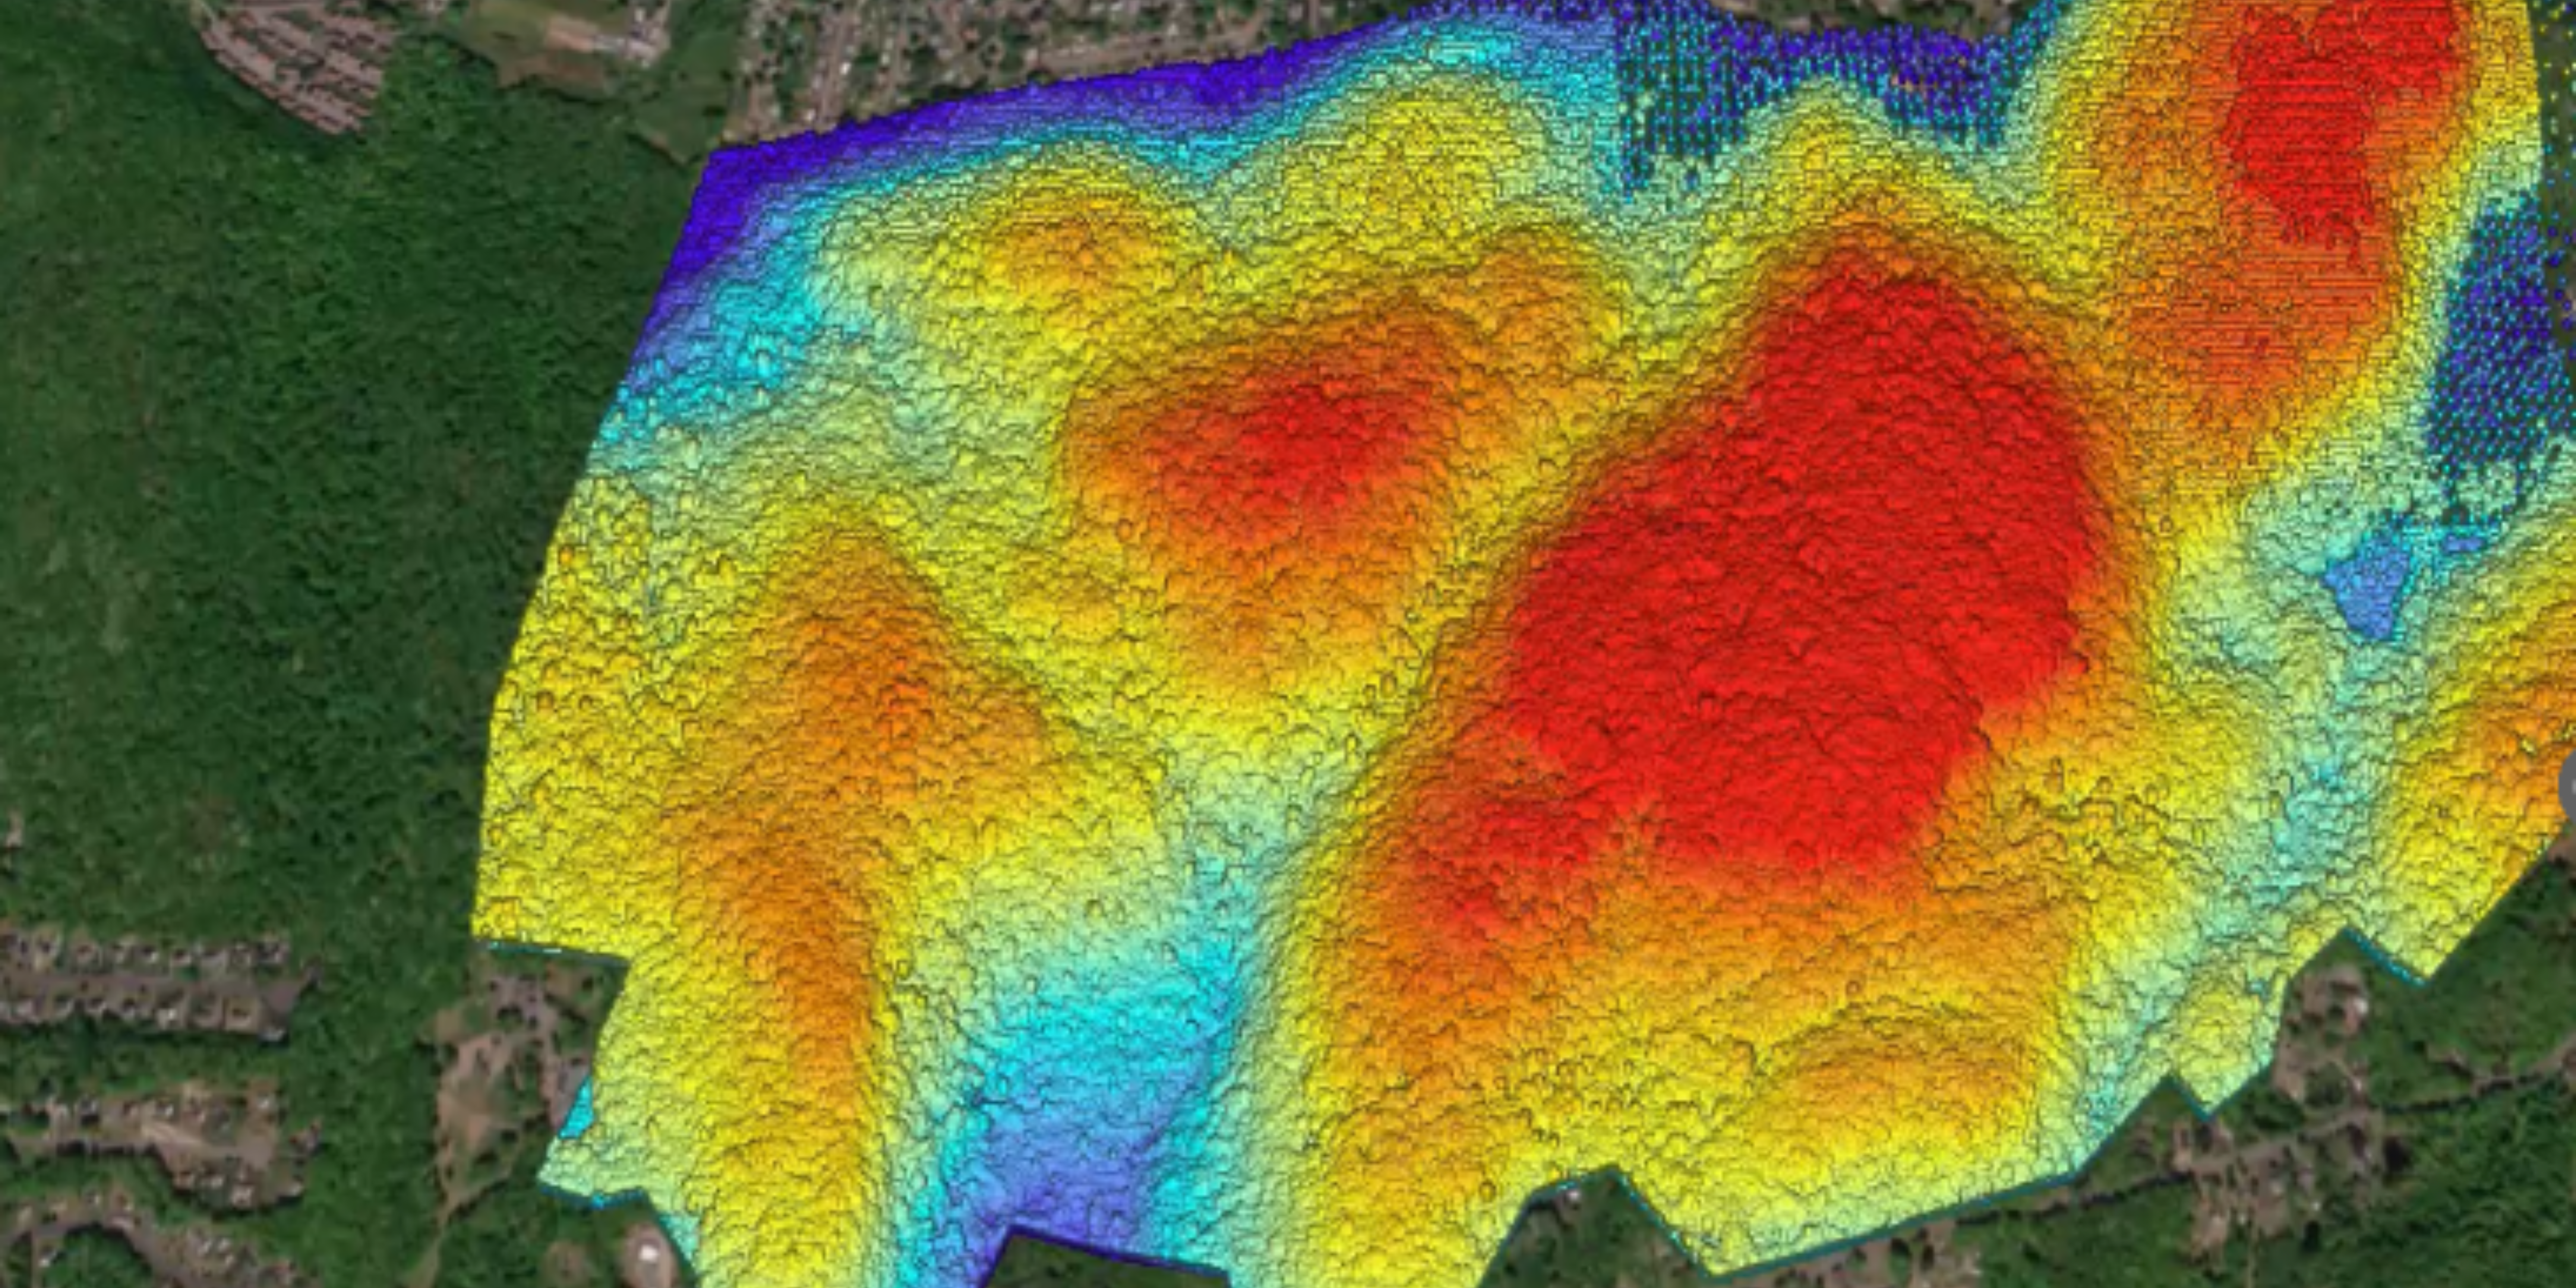
Fig 1. 3D Scene of Forest Canopy Structure (DSM).
As part of our analysis, we generated both Digital Surface Models (DSM) and Digital Terrain Models (DTM) to isolate canopy structure from ground elevation (Fig 1). Subtracting DTM from DSM allowed us to compute Canopy Height Models (CHMs) and derive detailed estimates of tree height and crown dimensions. We also assessed point cloud intensity values and point density (≥15 pts/m²) to better understand canopy reflectance properties and structural complexity, particularly in distinguishing old-growth from secondary forest characteristics.
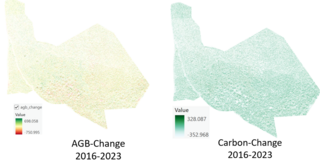
Fig 2. Changes in Cathedral Pines Forest from 2016 to 2023 (tons/ha).
From 2016 to 2023, mean aboveground biomass in Cathedral Pines increased from 172.5 to 197.7 tons per hectare, and vegetation carbon rose from 81.1 to 92.9 tons per hectare (Fig. 2), reflecting a general trend of forest growth and carbon accumulation across the study area. These estimates were derived from LiDAR-based structural analysis, including canopy height models (CHMs) used to estimate tree height and crown dimensions. Biomass values were calculated using established allometric equations that relate tree structure to carbon content.
However, results from some spectral vegetation indices (e.g., NDVI, CIgreen) indicate localized declines in vegetation greenness or health, suggesting that biomass gains are not uniformly distributed. Visual interpretation of aerial imagery also revealed signs of tree mortality in certain areas, potentially linked to natural disturbances such as disease, windthrow, or fire.
These observations highlight the spatial heterogeneity of forest dynamics—with some zones showing growth while others show signs of stress or decline. They also underscore the importance of combining structural, spectral, and modeling approaches to better understand forest condition. Future work will focus on field validation and investigating the causes of localized change.
As a next step, we aim to estimate forest volume directly and validate remote sensing results with field-based measurements. This work contributes to scalable, multi-temporal biomass monitoring that supports carbon accounting frameworks (e.g., REDD+) and informs conservation efforts across forest types and successional stages.
Data Sources:
High-resolution LiDAR and 4-band aerial imagery provided by the State of Connecticut Office of Policy and Management and accessed through Connecticut Environmental Conditions Online (CT ECO). The dataset includes USGS QL1 LiDAR (≥15 pts/m²), 3-inch resolution orthoimagery, DEMs, and classified point clouds.