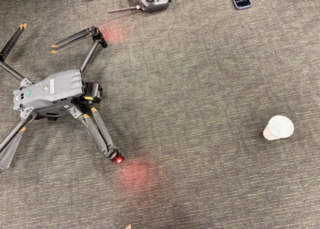
The flight hardware used was the Yale School of The Environment’s DJI Flight Matrice 300. This drone was flown using DJI Real-Time Kinematics during the April mission sets, providing more precise GPS data to the drone selected. To answer our research question and assess the relationship between NDVI and understory density, we implemented a series of UAV, remote sensing and data analysis techniques. After the drone flight was completed, we processed the lidar imagery in DJI Terra to create a point cloud. Furthermore, to determine the relationship between LiDAR-derived understory density and multispectral-derived NDVI, we used linear regression models and correlation coefficients. We used a linear regression model with NDVI as the independent variable and understory density as the dependent variable. We assessed a scatter plot of these variables and the R? and p-value from the relationship.
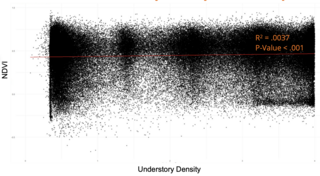
Overall, our study revealed a weak positive relationship between understory density and NDVI, as indicated by the Pearson correlation coefficient (0.0061) and the linear regression analysis (R2 = 0.0037). These results suggest that our hypothesis was partially rejected, as we hypothesized a strong positive association between understory density and NDVI due to increased biomass and productivity in denser understory areas. Although we did see a positive relationship, it was very weak. This weak correlation may reflect the complexity of forest ecosystems. For example, other environmental factors, such as overstory canopy cover, soil exposure, and light availability, and human factors such as management and land-use changes may influence NDVI values. The spatial variability observed in the CHM and NDVI maps further highlights areas where high understory density did not align with elevated NDVI values, potentially due to shadows, soil exposure, or ground-level vegetation effects. These findings emphasize the complexity of forest structure and the need for multifactorial analyses to capture vegetation health dynamics fully.
An exploration of LiDAR-derived landscape GIS products and tree crown segmentation from remotely sensed drone data over a Connecticut forest
Jeremy Pustilnik and Siria Gámez

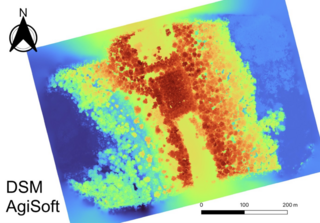
LiDAR data of a section of the Yale-Myers Forest was acquired on 14 September 2024 with a DJI Matrice 300 RTK with a DJI Zenmuse L2 payload. Two flight missions were conducted between 1200 and 1430 at a flight speed of 15 mph: one flight at 250 ft altitude above ground level (AGL) with 50% side and 70% forward overlap, and the other flight at 302 ft altitude AGL with 80% side and 90% forward overlap. The weather conditions at the time of both flights were sunny and clear, with light 5 mph wind and occasional 10-15 mph gusts. Raw data were pre-processed in program DJI Terra into a single LAS format point cloud. A third flight mission was conducted on the same day with a DJI Matrice 30T using the wide-angle camera for photogrammetry at 281 ft altitude AGL, a flight speed of 12.7 mph, and with a 70% side and 80% forward overlap.
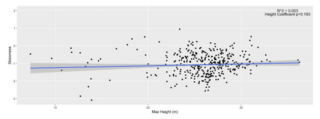
The lack of a statistically significant correlation between tree max height and canopy area is interesting because this indicates that taller trees do not necessarily have canopies with wider areas. Given the diversity of trees in this patch of forest (n = at least 18) different species that comprise the overstory canopy), this is unsurprising because not all tree species grow with the same proportion of trunk and branches to leaves, nor with the same ontogenetic strategy of how leaves are distributed along and throughout the tree. It is also known that taller trees face increased leaf water stress which may partially explain limits to canopy size, although our regression did not show a negative trend with tree height either. The statistically significant positive correlation between human-measured height and the LiDAR-derived height is expected because we would expect different tools for measuring tree height to at least be similar in distinguishing taller from shorter trees. What is unusual about this regression is that the correlation between the two methods is not close to a 1:1 ratio, as indicated by the low R2 value (R2= 0.09). This indicates that one or both methods aren’t particularly reliable, although we would expect if it was the former case, that the LiDAR method would be the superior of the two.
Multispectral Imaging: Drone vs Satellite and Classification of Yale-Myers Forest
Aslan Li, Louis Cimmino and María Alejandra Gallegos
The aim of this project was to explore applications of drone-based multispectral imaging technology for informing and improving forest management in mixed-conifer forests of northern Connecticut.
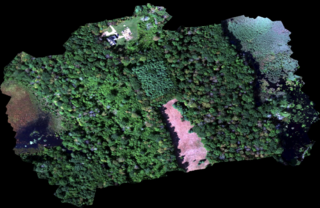
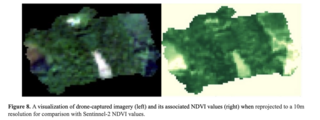
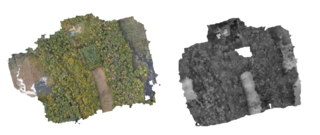
For this study, we used a DJI Matrice 300 RTK drone to collect multispectral images. The flight occurred at roughly 2:00pm on September 14, 2024. The drone flew at an elevation of 300 feet above ground level, capturing images with 70% side and 80% frontal overlap. We sought to create an orthomosaic to be used in both our reflectance comparisons as well as our classification tests. To create the orthomosaic, we utilized the Agisoft Metashape software. After importing and aligning the multispectral photos to the program, we built a point cloud and then the orthomosaic. We performed this process multiple times. To assess whether any significant patterning existed between the reflectance values of drone-based multispectral imagery and satellite-derived images, we reprojected the Red, Green Blue and Near Infrared bands of the multi-spectral orthomosaic into spatial resolutions matching each of the satellite image using Google Earth Engine. We also calculated the NDVI of the drone orthomosaic based on different scales of its reprojection. Furthermore, matching pixels from each band and the NDVI layer of the satellite and downscaled drone orthomosaics were extracted and plotted against each other. A linear regression was further calculated to quantify the correlation between bands of each product.
Unlike our results, other studies have found a stronger linear relationship between satellite multispectral bands and drone multispectral imaging and good agreement between Sentinel 2 and drone imaging. Although this research was not able to find a strong linear correlation between the drone dataset and the satellite data products, we were able to see a consistent patterning in the data. The similar data clustering distribution, a weak positive trend for red and NIR bands, and a weak negative trend for green and blue bands across three satellite products still provided us with valuable information about the underlying data. The study site contained varied form of land covers, such as water, cars, and buildings, which are smaller in size than the coarse resolution of Landsat and Sentinel and thus cannot be fully captured in the satellite products. These heterogeneous land cover types show different spectral performances and spatial variability compared to vegetation, which is only reflected in the high-resolution drone imagery. This scale mismatch and reprojection process could have introduced biases into the data comparison. Due to the differences in data coverage available, the orthomosaic also reflected lower uncertainty around the center of the image and higher uncertainty along the edges. Some geometric distortions are observable along the northeast and northwest edges of the mosaic. The satellite products, however, showed data consistency across the study site. The variation in data confidence and systematic errors could have also impacted the pixel values of the research.
Thermal image mosaicking and interpretation with Drones and Further Analyses of Yale Myers Forest, Connecticut
Ho Sze Koy, Murphy Tu, Xiaofan Shen
This project focuses on understanding and quantifying misalignment patterns observed across different flight altitudes, environmental conditions, temporal variations, and weather scenarios, and seeks to establish a robust method for converting thermal digital number (DN) values into meaningful temperature data without relying on simultaneous calibration tests.
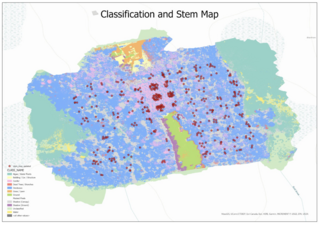
Four UAV flights were conducted at the study site, programmed with 70% side and 80% frontal overlap, to ensure sufficient data collection for analysis. Weather data from Myers Tower provided essential information on air temperature, humidity, and other meteorological variables during the UAV flights, ensuring a contextual understanding of environmental conditions when conducting the temperature conversion process. A drone zone stem map from Jacob was utilized to delineate the distribution and characteristics of trees within the study area, enabling a detailed analysis of temperature variations across different tree types. Additionally, digital elevation models and canopy height models from the LiDAR group offered critical 3D structural information about the landscape, aiding in the spatial alignment and interpretation of thermal data. Lastly, a classification map generated by the multispectral group provided land cover information, allowing the identification of thermal patterns across diverse landscape features.
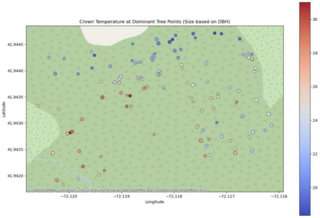
Overall, DEM provided little correlation with surface temperatures. Because DEM measures the height of each point of the survey area, this suggests that forest topography has little effect on surface temperature. However, CHM has some effect on surface temperature, most observable when CHM heights are divided into quantiles. This suggests that individual tree physiology might have some effect in surface temperature. Current literature posits two reasons for this. Older trees tend to be taller and have higher rates of evapotranspiration, which could lead to lower surface temperatures due to evaporative cooling. Thus, the relationship observed between canopy height and surface temperature could be a relationship between tree age and evapotranspiration rates. Alternatively, higher canopies tend to have higher rates of evapotranspiration because ambient temperatures and vapor deficits tend to be higher as canopy height rises, resulting in lower surface temperatures. The results in this paper suggest a correlation between canopy height and surface temperatures, and further research could be conducted to determine the causal link between the two.